
cross-posted from: https://lemmy.ca/post/40252119
Fair Vote Canada on Bluesky
How is this democratic?
It’s time for proportional representation.
#cdnpoli #onpoli
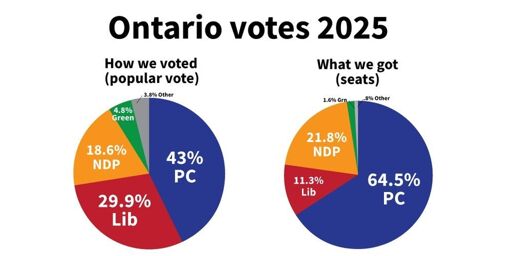
A political infographic titled ‘Ontario votes 2025’ compares the popular vote and seat distribution in the Ontario election. On the left, a pie chart labeled ‘How we voted (popular vote)’ shows: PC (43%), Liberal (29.9%), NDP (18.6%), Green (4.8%), and Other (3.8%). On the right, a pie chart labeled ‘What we got (seats)’ shows: PC (64.5%), NDP (21.8%), Liberal (11.3%), Green (1.6%), and Other (0.8%). The infographic highlights the discrepancy between votes cast and seats won under the first-past-the-post system.
Lol. Let’s not contribute to the problem by spreading misinformation.
deleted by creator
Ehh
deleted by creator
If you believe what you are saying is true, why bother getting into an internet argument?
deleted by creator
I agree.
There is no point.